Cycling, Weather and Cloud Cover
Feedback from users drives some of the best improvements to Epic Ride Weather, and this round is no exception. The latest improvement is cloud cover.
Lots of ideas came in about how this data could be shown. We experimented with a few, and quickly realized that use of the familiar weather icons such as 🌤🌦🌧 is impractical in most cases since Epic Ride Weather combines as many as 144 distinct forecasts for a single ride. In the end, we settled on including cloud cover in the precipitation chart since it is really good at providing visualizations for hundreds of values:
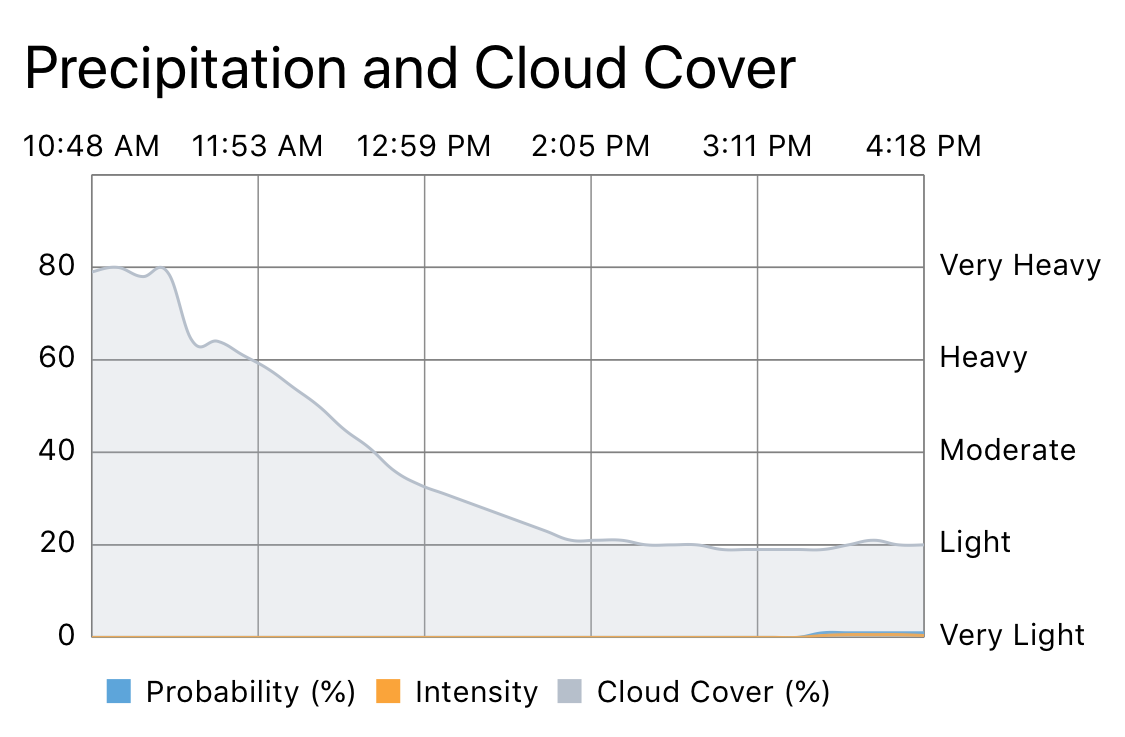 Epic Ride Weather showing cloud cover
Cloud cover is shown as a percentage of the sky obscured by cloud. For example, an overcast day would be shown as 100%, and a clear day as 0%. This forecast starts with mostly-cloudy conditions, improving to mostly sunny throughout the ride.
In addition to cloud cover, this latest release includes improved text when sharing, as well as date/time selection on Android now supporting 24 hour time format.
Enjoy!
Recent Posts
- How Lotto-Intermarché uses weather across the performance team
- Introducing Epic Ride Weather Events
- Official Supplier to Team Visma | Lease a Bike for 2026-2027
- Now Live: Real-Time Weather on Your Karoo
- Coffee Stops
- Official Supplier to Team Visma | Lease a Bike
- How Jumbo-Visma Uses Tech and Put Wout in Yellow at the Tour De France
- Dark Sky 2023 Availability Update
- How Jumbo Visma Put Vos Into Yellow at the Tour De France Femmes
- Bike Commuter Weather Forecasts
- VeloNews: One of the handiest cycling apps just got better
- All Articles
subscribe via RSS